Supporting shift-based workplaces post-pandemic with better data
 by
byTry When I Work for free

A year ago, when everything turned upside down, shift workers were the most radically affected by the restrictions and lockdowns. At When I Work, we knew we had to do something to help shift-based teams navigate this new environment. We created the Hourly Workforce Index to show insights and trends, so businesses could better adapt to the changing landscape.
Now that we’re a year past the initial shock of it all, we’ve decided to keep the Hourly Workforce Index going. But it will look a little different from now on. We’re changing the way we measure so we can better report on how the hourly workforce is fairing in the post-pandemic world.
What happened last year
During the pandemic, we were focused on measuring what was happening at the time against what we would expect to happen in a normal year. We call that normalizing, and our amazing data science team did it every month, so you got the best view of what was actually happening. Check out our year in review video, What 2020 taught us about hourly work, to see a snapshot of what we learned.
What’s changing
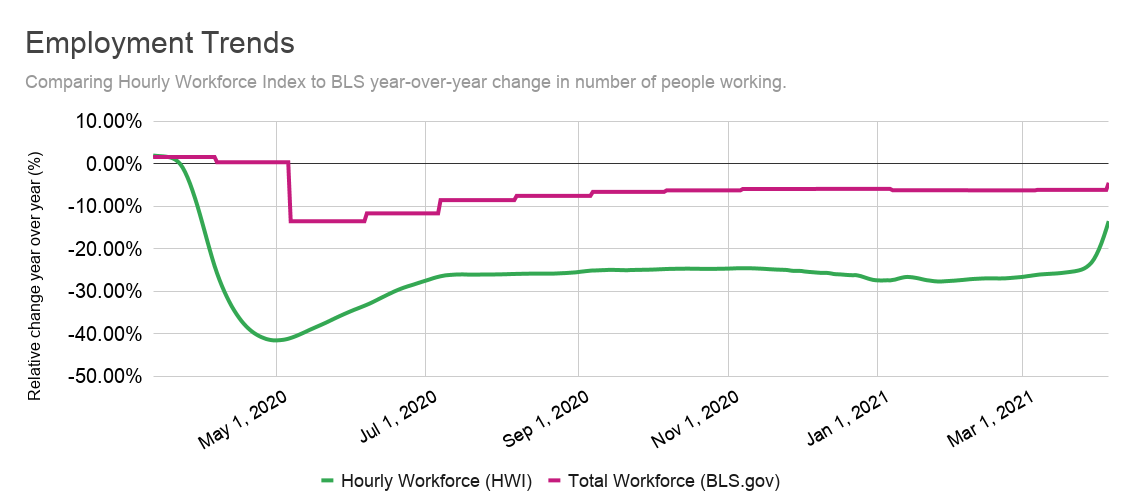
Now, like everyone else in the world, our data is starting the slow transition back to regular life. That means from here on out, we’re doing away with the normalizations and we’ll be showing pure year-over-year progress. So our charts will now show how much we’ve improved this year, directly compared against a turbulent 2020—and you’ll be able to see how the hourly workforce is doing as part of the long-term recovery. Plus, we’ll also compare our Hourly Workforce Index results against the Bureau of Labor and Statistics (BLS) results to show the year-over-year difference between the overall national numbers and the hourly workforce, like this:
What the data will look like going forward
Initially, you’ll see a big contrast from what happened last year. The biggest decline was in April 2020, so we expect to see the biggest improvements in April 2021. The charts after April will show much we’ve improved on top of the recovery made in 2020. In other words, once we pass the lowest point of the dip, we’ll really be able to see how far we’ve come.
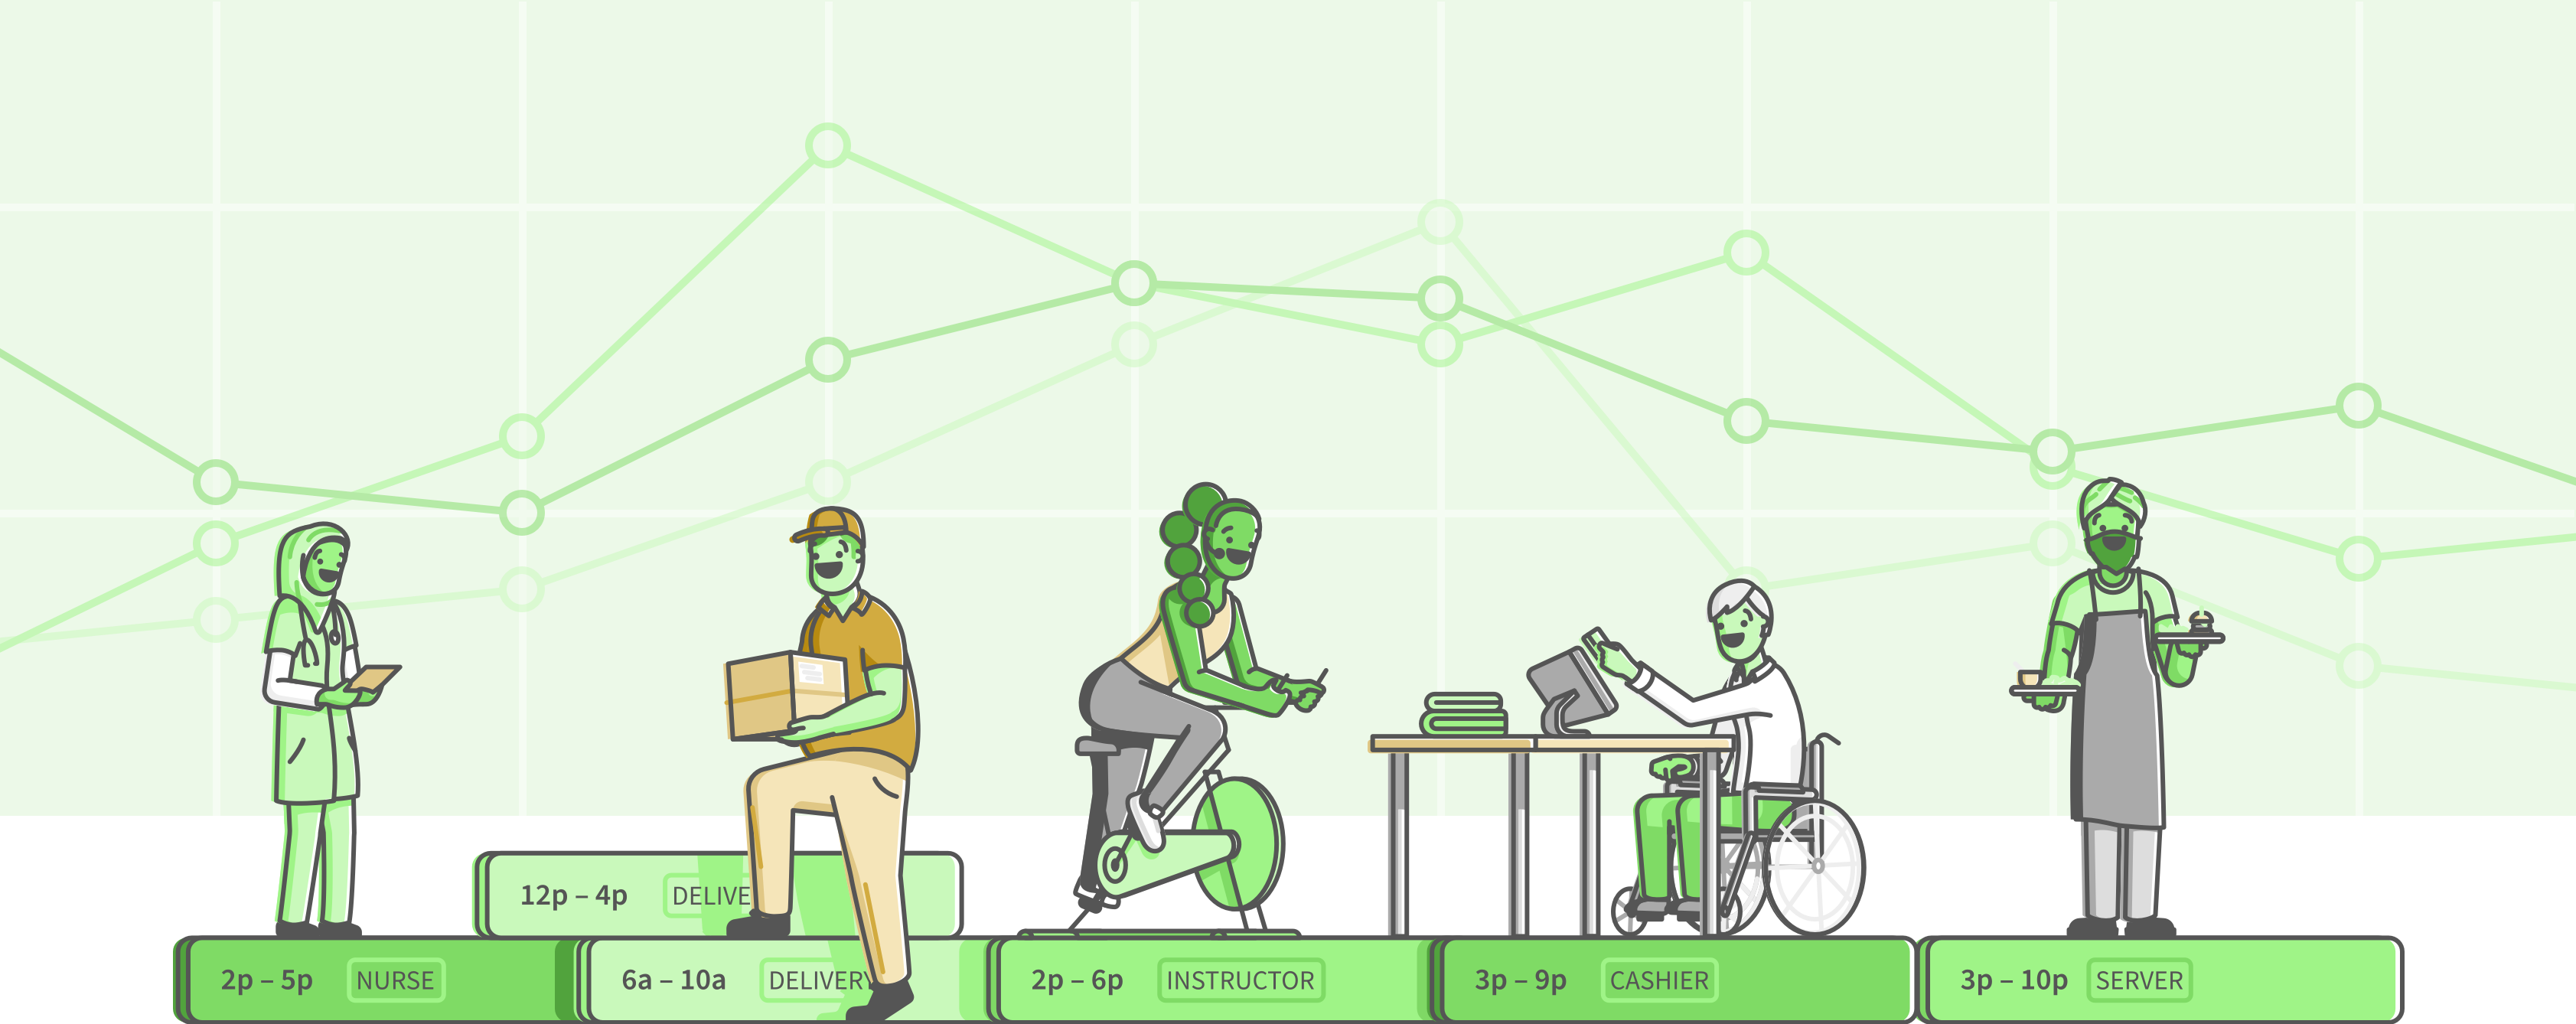
When I Work has nearly 200,000 workplaces on our platform. That means millions of employees work hundreds of millions of hours and generate billions of data points. We believe it’s our duty to turn that data into actionable insights for hourly workplaces, so they can find better solutions to new challenges. You want relevant, specific data for your shift-based team, and we’re here to give you that so you can make smart decisions.
We have always given you reliable information, and we’re committed to continuing that in the future. To make sure you get the latest numbers each month, subscribe to our Future of (Hourly) Work blog and we’ll send the monthly report right to your inbox.